Based on science’s most trusted analysis software platform, MountainsSpectral® is a comprehensive, dedicated solution for processing & combining images and other data from spectroscopic techniques including Raman, TERS, IR, nanoIR, fluorescence, photoluminescence, cathodoluminescence, EDX/EDS and XPS.
- Colocalize images and spectral maps for correlative analysis
- Process and enhance spectral maps
- Quickly process and enhance images
- Create high-quality 3D overlays
- Load multi-channel cubes and visualize composition of materials in full 3D
- Perform spectral analysis including pre-processing, band analysis and multivariate analysis
- Access particle analysis tools for spectroscopic data
- Classify features and apply powerful statistical tools
News, events, promotions, webinars
Correlative analysis
- Colocalize images and spectral maps from a single instrument or multiple instruments (Raman spectroscopy, cathodoluminescence, fluorescence, EDX, EELS, AFM, SEM etc.)
- Combine information from different sources into a single, multimodal dataset
Process Spectral Maps
- Process Raman, cathodoluminescence, photoluminescence, fluorescence, EDX/EDS and EELS maps
- Choose which layers of data you wish to use in rendering
- Color mixing tool: choose to mix layer colors or use dominant color
- Reduce image noise
- Play with transparency levels
Process & enhance images
- Correct and enhance images obtained through spectroscopic techniques
- Apply smoothing filters, remove image artefacts, fix lighting and interactively adjust brightness and contrast.
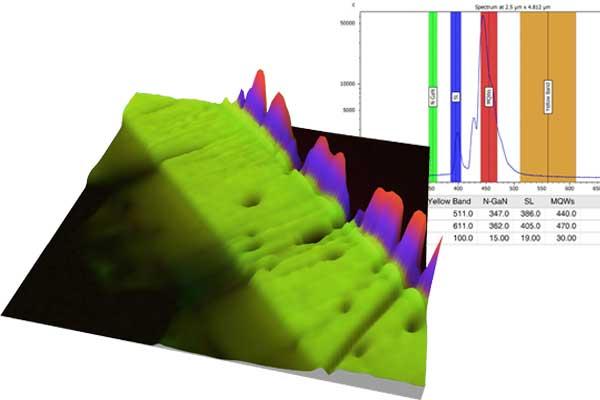
Overlay compositional data on images (optional module)
- Create 3D chemical maps by colocalization with microscopy images or topography data whenever available (TERS, confocal, SEM stereo reconstruction etc.)
- Generate chemical maps with 3D-texture effects using single SEM images or optical microscopy images as backgrounds
- See composition of materials in full 3D
- Associate tomography & chemical analysis
- Analyze each voxel as multiple channels, one per material (for example using confocal Raman, FIB-SEM in EDX imaging mode)
- Choose from a wide range of visualization & animation settings including dynamic image segmentation and filtering
- Use color mixing and 3D image segmentation simultaneously to see where particles of one material are located in relation to others in the cube
- Show/hide each material in just one click (and choose to “cut away” any material when you wish to see the others)
- Extract slices as color images
- Cut through the cube in any orthogonal direction to extract a multi-channel image (chemical map) for 2D analysis
- Generate Shell studiables (freeform surfaces) from multi-channel cubes to study particle morphology
- Produce particle and grains statistics directly from cube data
Process & analyze spectra
- Get spectra ready for analysis: correct the base-line & filter to remove noise
- Display spectral bands as a colored image
- Reduce data cubes to a number of significant spectra using multivariate analysis
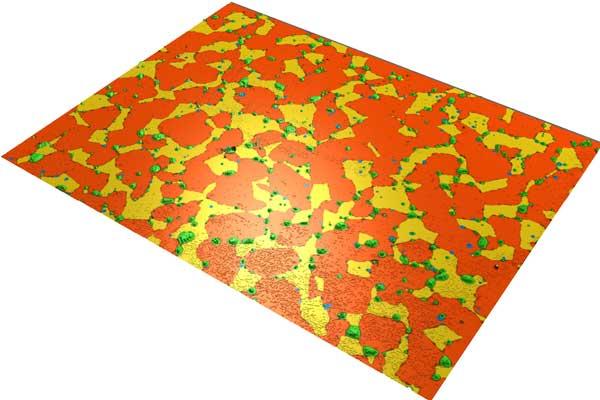
Particle Analysis (optional module)
A comprehensive toolset for detecting and analyzing particles, pores, grains, islands etc. on structured surfaces
Includes most features of SPIP™ software created by Image Metrology.
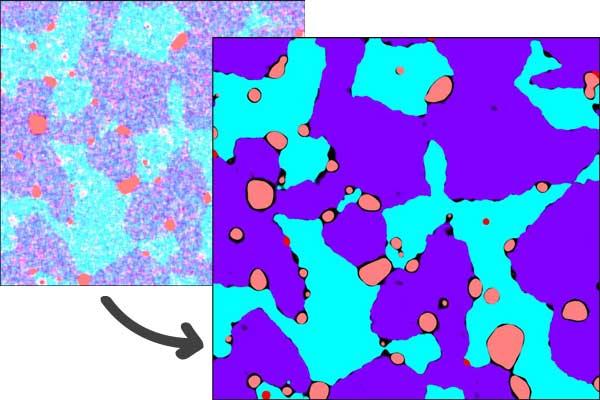
⇒ Detect any feature – choose from a range of feature detection methods based on different segmentation principles:
- threshold segmentation (detect particles using user-defined thresholds)
- watershed segmentation (using the method defined in the ISO 25178-2 standard)
- edge detection (apply an edge detection filter)
- circle detection (detect round or spherical particles).
⇒ Multi-channel file management – in the case of a file containing several data channels, choose which data channel to use for feature detection.
⇒ Particle classification – detected particles can be grouped into different classes based on their characteristics, such as their geometrical shape, height or size.
⇒ Spherical caps – calculate and show spherical caps contained in particles.
⇒ Display options – access a wide range of graphical representations and customize display of results:
- overlay (see particles in pseudo-color)
- motifs (see on a monochrome background)
- colored (use color and manage transparency)
You can also choose to superimpose a pseudo-color view of particles on 3D surface topography.
⇒ Generate charts and statistical results for all particles, subsets of particles or individual particles.
⇒ Calculate ISO 25178 feature parameters (Spd, Spc, S5p, S5v, S10z, Sha, Sda, Shv, Sdv) and apply Spd (peak density) and Spc (arithmetic mean peak curvature) parameters in tribological studies, for example for plasticity and elasticity.
⇒ Analyze texture direction – display a compass rose showing texture direction(s) – calculate surface isotropy.
⇒ Analyze furrows (dermatology) – detect and visualize furrows above or below a threshold height – calculate furrow parameters: max depth, mean depth and mean density.
Watch Digital Surf webinar on Particle Analysis with Mountains® by following this link.
Keep track of your work
- MountainsSPIP® unique analysis workflow lets users see all the analysis steps already applied to data
- Update any step, at any time. Dependent steps are automatically updated.
Powerful automation
- Speed up your analysis process
- Build templates to reapply analysis steps to other datasets
Easy publishing & Report creation
- Processes organized into a document layout "as you analyze"
- Save your work in PDF and Word formats and share it with colleagues, students, clients, etc
- Build your own tutorial-templates to share illustrated and commented analysis recipes with colleagues and students
MountainsSpectral® Premium | MountainsSpectral® Expert | MountainsSpectral® Correlate | |
|---|---|---|---|
Instrument compatibility | Spectroscopic techniques: Raman, TERS, IR, nanoIR, fluorescence, photoluminescence, cathodoluminescence, EDX/EDS, XRF | Spectroscopic techniques: Raman, TERS, IR, nanoIR, fluorescence, photoluminescence, cathodoluminescence, EDX/EDS, XRF | Spectroscopic techniques: Raman, TERS, IR, nanoIR, fluorescence, photoluminescence, cathodoluminescence, EDX/EDS, XRF |
Colocalization for correlative analysis | Y | Y | Y |
Spectral map processing, enhancement & composition | Y | Y | Y |
Image correction & enhancement | Y | Y | Y |
Topography analysis (i.e. based on AFM images) | Y | Y | |
High-quality overlays of compositional data on topography | Y | Y | |
Advanced processing & analysis of spectra | Y | ||
Particle analysis | Y | ||
Multi-channel (chemical) cubes visualization & analysis | Optional module | Optional module | Optional module |